Learn
Understand the data before you use it
Short, plain-language guides to option-chain zones — written so you do not need a trading background. We explain what you are looking at; you decide what it means for you.
Disclaimer
FNONINJA shows derived observations from public option-chain data. We do not recommend trades, predict outcomes, or tell you what to buy or sell. You are responsible for your own analysis and decisions.
5 guides
Loading History ....
Highest put OI strike below spot — support.
Highest call OI strike above spot — resistance.
Strike where total option payout is lowest.
Line gets thicker when that wall's OI builds day over day, thinner when it decays.
Only the heavier side glows — green for puts, red for calls; strength tracks the % gap between wall OI.
Hover any day for strikes, OI, and dominance.
Index History: Validate Max Pain, OI Momentum & Dominance Over Time
Six months of daily put walls, call walls, and max pain on every NSE index — with line thickness for OI momentum, glow for put-vs-call dominance, and links to verify every pattern yourself on the History tab.
6 min · live example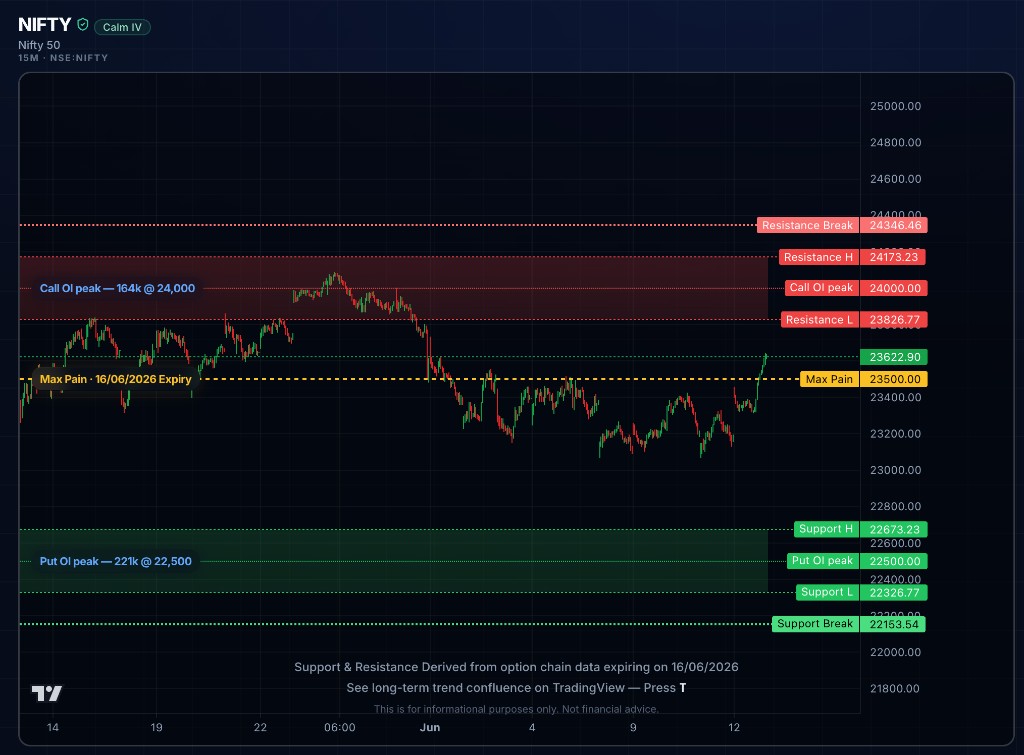
Mastering Option Zones: The Science Behind Put/Call Clusters, Max Pain & Expiry
Understand how Put Clusters act as support, Call Clusters as resistance, Max Pain influences price near expiry, and how hedging activity shapes NIFTY price action — with live charts and practical verification steps.
5 min · scroll to exploreIndex Outlook: A Beginner's Guide to the Forward Levels Ladder
Outlook maps support, resistance, and max pain across upcoming expiries for every NSE index — with a live NIFTY example, how to read the ladder, and what it does not predict.
5 min · live exampleChange in OI at the Wall: What ▲ and ▼ Mean on Your Chart
A plain-English guide to open-interest change at put and call clusters — with a live NIFTY chart example, where to see ▲/▼, and how to use it without over-reading the signal.
4 min · live exampleNifty 50
What would you like Atlas to help you explore for this symbol?
Atlas AI Coach: Hedged Ideas from the Chart You're Already On
Atlas turns zones, OI walls, and IV into defined-risk scenarios — or answers FAQ-only questions. Live NIFTY example, the three-request menu, and why strategies stay on the chart (not in this guide).
5 min · live example